![Northam Platinum Limited [logo]](i/logo.gif)

Financial perfomance review
Consolidated statement of comprehensive income
Revenue
Economic recovery following the global financial crisis of 2008 and 2009 has been slow, which has had a dampening effect on demand for resources, and consequently on metal prices, which have yet to recover to pre-financial crisis levels.
Total revenue from the sales of all metals was 23.8% higher year on year mainly as a result of an 18.8% increase in volumes sold. Although the average US dollar basket price increased by 18.4% during the year to US$1 185/oz, this was largely negated by an average rand exchange rate decrease of 13.2% to R7.57/US$, resulting in an average rand basket price of R288 255/kg (3PGE+Au), which is 2.7% higher than the previous year’s average rand basket price.
The growth in sales volumes was achieved on the back of higher production, metal gains and the increase in purchases of metals in concentrate from the treatment of secondary material (480kg). Production of metals in concentrate during the year increased by 6.3% to 9 999kg (321 475oz), with the volume of concentrate purchased amounting to 2 106kg (67 709oz) compared to 487kg for the 2009 year.
| Units sold kg | F2010 Average price received R/kg |
Revenue R000 | Units sold kg | F2009 Average price received R/kg | Revenue R000 | |
|---|---|---|---|---|---|---|
| Platinum | 7 546 | 353 507 | 2 667 420 | 6 288 | 325 730 | 2 047 965 |
| Palladium | 3 617 | 93 417 | 337 929 | 3 046 | 66 509 | 202 606 |
| Rhodium | 891 | 532 925 | 474 980 | 848 | 721 775 | 612 217 |
| Gold | 259 | 266 528 | 69 015 | 180 | 249 094 | 44 894 |
| Sub-total – 3PGE + Au | 12 313 | 288 255 | 3 549 344 | 10 362 | 280 609 | 2 907 682 |
| Iridium | 293 | 114 364 | 33 544 | 249 | 122 682 | 30 521 |
| Ruthenium | 1 352 | 34 875 | 47 132 | 1 227 | 31 108 | 38 167 |
| Other precious metals | 337 | n/a | 1 385 | 200 | n/a | 736 |
| Sub-total – precious metals | 14 295 | – | 3 631 405 | 12 038 | – | 2 977 106 |
| Nickel (tonnes) | 1 752 | 148 373* | 259 966 | 1 529 | 113 715 | 173 905 |
| Copper (tonnes) | 957 | 47 594* | 45 549 | 800 | 40 987 | 32 806 |
| Other by-product revenue | 8 163 | 2 225 | ||||
| Total sales revenue | 3 945 083 | 3 186 042 |
* Rand per tonne
Cost of sales
| F2010 | F2009 | |
|---|---|---|
| R000 | R000 | |
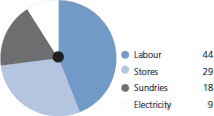
| Labour | 974 701 | 824 278 |
| Stores | 649 992 | 599 636 |
| Utilities | 208 478 | 140 577 |
| Sundries | 386 088 | 344 234 |
| Decommissioning and restoration | 1 111 | (2 836) |
| Total operating costs | 2 230 369 | 1 905 889 |
| Concentrates purchased | 735 090 | 140 192 |
| Refining and other costs | 92 972 | 120 917 |
| Depreciation and impairments | 167 346 | 160 907 |
| Change in metal inventories | (65 669) | 40 224 |
| Cost of sales | 3 160 108 | 2 368 129 |
The cost of sales increased by 33.4% to R3 160 million compared to the previous year, reflecting not only the increased mining input costs, but also the higher cost and volumes of concentrates purchased.
Operating costs
Operating costs increased by 17.0% driven by higher mining input costs, particularly labour, power, steel and explosives.
Employee and related costs increased by 18.3% owing to increases in wages, contributions to the employee empowerment trust, and an increase in staff members eligible to participate in the company’s share option scheme. Increases in the stores reflect primarily the costs of steel which rose by between 10% and 15%, chemicals which rose by between 13% and 25% and petroleum-related products by 9%. The utilities bill increased mainly due to Eskom’s two price increases in the year – one of 31% in July 2009, and a further 25% in April 2010.
In addition, the new royalty, payable by mining companies from March 2010 in terms of the Mineral and Petroleum Resources Royalty Act, which amounted to some R21 million, has been included in operating costs.
A further breakdown of costs associated with the company’s operations are reflected in note 23 of these annual financial statements.
Concentrate purchases
During the year, metal concentrate to the value of R735.1 million (F2009:R140.2 million) was purchased. Although the margins for the purchased material are low, the increased purchases reflect progress in the company’s stated strategy of building up capacity for enhanced downstream beneficiation. The concentrate is also purchased for its high sulphur and low chrome content which is important for the optimisation of the smelting process. The higher value of purchased concentrate compared to the previous year is due to both increased volumes purchased and higher prices paid.
| Purchased concentrate | Own production | Total | |
|---|---|---|---|
| Kilograms sold (3PGE+Au) | 2 106 | 9 999 | 12 105 |
| Sales revenue (R000) | 716 307 | 3 228 776 | 3 945 083 |
| Cost of sales (R000) | 746 803 | 2 413 305 | 3 160 108 |
| Working costs (R000) | 19 866 | 2 377 849 | 2 397 715 |
| Change in metal stocks (R000) | (22 704) | (42 965) | (65 669) |
| Refining costs and other costs (R000) | 14 551 | 78 421 | 92 972 |
| Purchase custom material (R000) | 735 090 | – | 735 090 |
| (30 496) | 815 471 | 784 975 | |
| Treatment charges recovered (R000) | 45 775* | ||
| Contribution to operating profit (R000) | 15 279 |
Refining and other costs
As anticipated, following the rebuild of the smelter during the previous year, refining and other costs were 23.1% lower at R93.0 million in the current year.
Depreciation and impairments
The depreciation charge increased marginally to R167.3 million, reflecting the steady state nature of mining at the Zondereinde mine.
Change in inventories
Metal inventories increased by R65.7 million as a result of the temporary closure of the precipitator towards the end of the year and the growth in purchases of concentrate.
Operating profit
The effect of higher inflation on production costs and on purchased metal concentrate is a lower operating margin for the company, down from 25.7% in the previous year to 19.9% in the current financial year.
Income from associate
The share of profits from associates of R12.4 million represents Northam’s 7.5% share in the Pandora project’s profits. In the prior year, the associate’s share of profits amounting to R72.6 million represented several years’ worth of profits which Northam became entitled to as a result of its updated empowerment status. The comparative figure for the 2009 year was R4.8 million.
Investment income and net sundry income
Investment revenue increased by 28.6% as a result of the interest earned on the investment in escrow. The investment in escrow is payable to Anglo Platinum Limited upon the transfer of certain new order mining rights in respect of the Booysendal extension to Northam.
Hedging
There was no hedging activity during the year, consequently there were no outstanding contracts at the end of the period.
Tax charge
The tax liability for the current year is R333.6 million compared to R384.0 million in the previous year. This equates to an effective rate of 34.2% (2009: 37.9%), some 6.2% higher than the statutory rate of 28.0%. The additional 6.2% is mainly due to the state’s share of profits tax effect of 3.1% and secondary tax on companies (STC) effect of 2.2%. A more detailed analysis of the tax paid, including the effect of permanent and minor differences is set out in note 28 to the annual financial statements on page 48.
Cost profile (%)
Net profit attributable to shareholders
The combined result of the above factors, plus higher sundry revenue is that the group profit attributable to shareholders is 1.7% above the previous year’s at R641.3 million. Headline earnings have increased from 172.2 cents per share to 177.8 cents.
Consolidated statement of cash flows
Operating cash flow
Operating cash flows of R862.4 million are higher by R144.6 million compared to the previous year. Working capital requirements increased by R90.7 million mainly as a result of higher trade receivable and inventory levels, whilst tax payments amounted to R281.8 million. The lower tax payments are as a result of the lower tax charge for the year as well as the lower tax liability at the end of 2009, which was paid in 2010 compared to the 2008 tax liability paid in 2009.
Investing cash flow
Investing cash flows are lower than the previous year and they consist of capital expenditure for the Zondereinde mine of R231.5 million, R132.4 million for the Booysendal mine and R4.0 million for the employee housing project. Although there was new capital expenditure of R132.4 million at Booysendal this year, the previous year’s investments in the Pandora project, township development and the Toro Employee Empowerment Fund led to higher investment cash flows in that year.
Financing cash flows
Financing cash flows are lower than the previous year as a result of dividends absorbing R216.2 million in the year under review compared to R802.1 million in the previous financial year.
Net increase in cash resources
The combination of the above mentioned cash flow factors resulted in a net cash inflow of R265.8 million for the year, increasing the group’s cash balance at year end to R1 186 million.
Booysendal mine
In February the board approved capital expenditure of R340 million to fund the early works programme, in order to establish initial infrastructural facilities, which is currently in progress.
The board has also given its approval for the development of the mine to proceed at an estimated capital expenditure of R3.6 billion (in March 2010 money terms) for phase 1 of the Booysendal mine. This follows the conclusion of the optimisation study on the project which concluded that the project could support a run of mine production rate of 187 500 tonnes per month (162 000oz p.a (3PGM+Au.).
Capital expenditure incured on the project to date is R132.4 million. The primary construction activities will start as soon as certain outstanding regulatory approvals are obtained.
Consolidated statement of financial position
The financial position of the group is robust with cash resources of R1 186 million at 30 June 2010 (2009: R921 million) and other current assets of R931 million (2008: R695 million).
The environmental decommissioning and restoration liability is R65 million (2009: R54 million). Apart from this liability and the deferred tax provision of R447 million (2008: R429 million) the group has no long-term debt.
Commitments have been made for minor capital expenditure and cash backed guarantees offered to the Department of Mineral Resources in terms of South African mining legislation to make provision for rehabilitation.
Dividend
A total dividend of 40 cents per share was declared in respect of the 2010 financial year, raising the dividend cover to 4.5. The higher dividend cover was considered prudent in view of forthcoming funding requirements for the development of the Booysendal project.
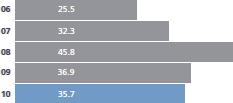
Share performance compound return over 5 years
NORTHAM ANNUAL REPORT 2010